A Program Grid report allows users to create a report that is more visual in appearance. Unlike the traditional reports, it will display program information in "grids" instead of rows. In this guide, users will utilize a combination of Data Types in different sections of the selected pane to build a program grid report.
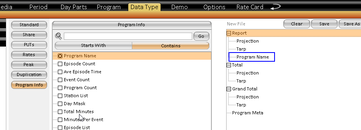
To build a report which utilizes program meta information, users must first ensure that Program Name has been selected as a data type. This data type must be in the Report section of the selected pane. Additional data types such as Projection and TARPs should also be added. Note that when selecting data types, these are added to the Report, Total and Grand Total sections only.
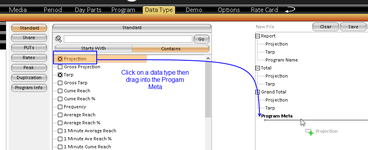
Add data types into Program Meta by dragging the required data types into the Program Meta section.
Before building the report, ensure that the required stations have been selected. Note that if multiple markets or network levels have been selected, the result will display all programs.
Building a program grid report:
Using the layout assets, drag the day part interval (1min, 5 min, 10 min etc) on to the rows. In the columns drag stations, and directly under stations, drag Data Type. In the example below, Demo has also been placed on the columns.
The layout in this example displays the Station's Projection and TARP at 5 minute intervals, as well as the Program Name column. Within the program grid, the program meta will display the projection for the entire program