The eTAM Visual Schedule builder (VSB) is designed to easily build a schedule which can contain various variables such as reach and frequency by using a spot selection format. The spot selection tab can be set to display days on either rows of the columns, while an "All Stations" feature saves time by allowing spots to be placed across all selected stations:
To build a a schedule:
- Open an eTAM Visual Schedule report via the main tool bar; "New>eTAM Visual Schedule builder". The report may open as a blank report or a complete report layout has already been set depending on the set-up. However in either case, the report layout can easily be customized using the layout assets.
- In the media tab - select the required channels. In this example History, Animal Planet etc. Note that in the VSB report, the lowest media level is channel.
- In the Period tab - select the plan weeks/survey weeks required. See week averages for more information.
- In the day part tab - select the day part required. Day parts should be selected if the schedule requires specfic spot placements or if day parts have different costs associated to it. If no day part is selected it will default to "all day".
- In the data type tab - select the required data type for the report. Common data types used for schedules can be found in the R n F selection screen which can include the following:
- Cume Reach (RF)
- 1+, 2+ etc
- TARP (Standard screen)
- Spot Count
- Ave Freq
- Go to the Spot Selection tab (see below) - enter the required spots
- Once all spots have been entered go back to the report tab. If required, build a report layout and run the report.
Spot Selection Tab
The selections from the above steps determine what variables are visible in the spot selection screen. In below example, the day parts of Peak and Off Peak is on the rows. Generic plan weeks 23-26 2017 is on the columns.
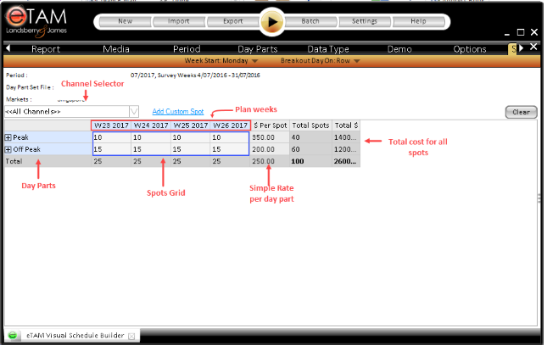
Image Title
There are five sections spot selection screen:
- Rows - This will contain the day parts selected which can be expanded to days.
- Columns - This will contain the plan weeks, users have the option to breakout the days by using the sub-menu "Breakout Day on: Columns"
- Cost per spot - this is the cost per sport.
- Total Spots - automatically counts the spots entered in the spots grid.
- Total $ - this automatically sums the number of spots to cost per spot to give a total cost.
- Spots grid - number of spots is entered in this area.
- Channel Selector - Select channels for costumized spot placements. Or enter spots at the "All Channels" level which will replicate spots in all channels on the list. Any spots entered/deleted at the All Channels level will overwride spots in individual channels in that cell.
To enter spots:
Simply enter the required number of spots per day part. In the above image 10 spots has been placed for each week for peak which is a total of 40 spots.
Users can multi select cells and then enter the number of spots - this will apply the same number of spots for the selected cells.
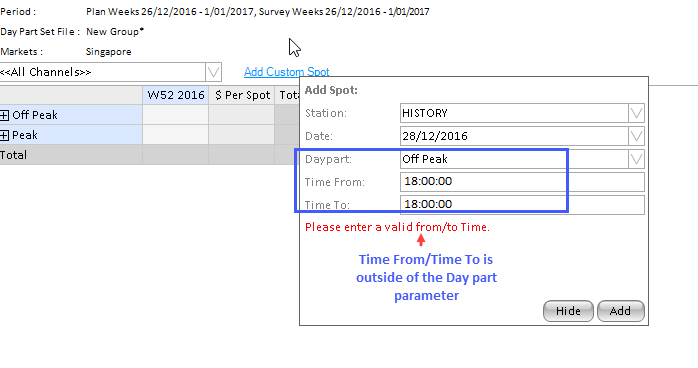
Add Custom Spots Tool:
This tool allows uses to enter spots using a drop down menu, which allows spots to be entered for a specific channel, date (day) and a specific time within a day part.
- On the Add Custom spot menu, select the stations avaialable
- select the required date
- select the day part
- enter the required time from and time to - NOTE that entering a time outside of the selected day part in step 3 will be invalid (as shown delow)
- Click the "Add" button