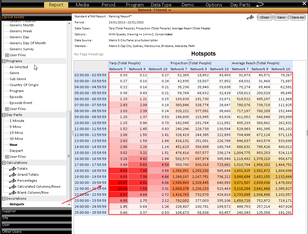
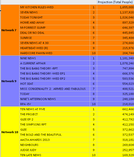
Hotspots and Highlights is one of the many features of eTAM XTC.
Hotspots
Hotspots in eTAM XTC allows for a visual colour overlay to be added to a Report to quickly show the high and low data points (or hotspots) in the grid. Hotspots can be applied using a percentage value or an actual value. They can be set up according to a number of criteria and displayed in different ways.
How to Apply Hotspots
Hotspots is located at in the layout assets under 'Decorations'. You can double click from the layout assets which will apply hotspots to the report grid.
To edit the hotspots:
- Right Click on either the report grid or on the "Hotspots" in the Layout Assets and select Edit Hotspots
- The Hotspots dialog box will appear. In the top half of the window are the available hotspots options. The bottom half of the window is any hotspots options you have already created.
- First select between creating a hotspots based on Percentage or Value
- Using the drop down menu, select what data type you want to apply this Hotspots to (Projections, reach etc).
- In the From and To box, either enter the the values required or use the drop down menu to select minimum and/or maximum
- In Apply to -select how you want the hotspots to be displayed. The choices are to colour the Background of the cell, the Text of the cell or the Border of the cell. A default colour range of white to red will be displayed in these Apply to boxes and in the Preview bar below. To change the colour scheme - drop down each Apply to box and select "Colour Select". Select from the available Basic colours or create your own using the "Define Custom Colours". To select a colour hit OK.
- Next you need to decide if you want your hotspots range to apply universally across the whole grid (Hotspots - Universe) - OR - apply a hotspots range in each row (Hotspots - apply across each row) - OR - apply a hotspots range in each column (Hotspots - Apply across each Column) by clicking on the appropriate radio button.
- Click the Add button. This will display display the hotspots section criteria in the bottom half of the window.
- Repeat steps 3-8 for additional other hotspots options as required.
- Click OK
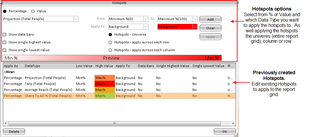
Other Hotspots Options available:
There are 3 options also available in the Hotspots dialog box available.
Show Data Bars - graphical proportions the background colour based on the value rather than highlight the whole cell.
Show Single Highest Value - This will highlight the single highest value
Show Single Lowest Value - This will highlight the single highest value
Editing and Deleting Hotspots
To edit or delete an existing hotspots:
- Right Click on the grid and select Edit hotspots from the menu
-
Double click on the hotspots you wish to edit from the list of hotspots displayed in the bottom half of the window
-
Make changes as required or DELETE
-
Click on the Apply button
-
Click OK to exit the window
Highlights
eTAM XTC allows users to select any item/s in almost any selection tab to be highlighted in the report layout for easier tracking. This item (and its related sub-items) will be highlighted in a colour specified by the user. Multiple items and colours can be can be highlighted in the one report if required. The only tabs that does not allow for highlights are Day Parts
Highlights
How to select an item to be highlighted
At the Media, Period, Program, Data Type and Options you can select items to be highlighted. At the bottom of the selected pane within these tabs you will see a grey box with "Highlights - Add Here".
To add the items:
- If your item is in the selected pane - DRAG the item into the "Highlights - Add Here" box
- If your on the selection windows, right click on the item and select "Add to highlights"
To change the colours:
- Right click on the an item in the Highlights - Add here box - and select Adjust colour
- Select from the available basic colours or use the the 'Define Custom Colours' Tool.
- Click OK to exit
Once you have made your highlights options, run your report to see the highlights to take effect.