There are a number of different types of settings contained in Global, User and Report tabs in the Settings button. Some of them will be found in all three tabs - others may only found in one tab. Depending on which tab you make the change in they will apply differently.
For instance; you want to make a change to the decimal display to 2 decimal places. If you change this at:
- Global - (Which only site supervisors can do), it will apply this change to all reports currently opened, any new reports opened from that point on and any saved reports from then and reprocessed by ALL users.
- User - Specific to that user's login only. It will apply this change to all reports currently opened, any new reports opened from that point on and any saved reports opened after that time and reprocessed by THAT user only.
- Report - it will apply this change to the open report only.
Settings Options in detail
In the settings tabs similar items are grouped together under headings. For more detailed explanation of each setting please see below:
Theme (User Level Only)
There are two options in this sections:
Active Theme - choose between Default and Default Smaller Fond and Large headers
Active Font - select the font type you would like in eTAM XTC from the list provided
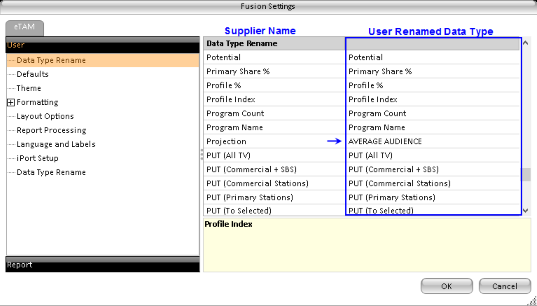
Data Type Rename (User and Report level)
This allows users to rename data types from the supplied name to a desired name. For example, eTAM data type for average audience is called "Projections" this can be renamed to "Average Audience" on the right column.
Formatting:
To change the display options of a data type such as the Divisor (1's - 0000's), Decimal places or Periods. Depending on the Item you have selected in the Formatting tree, the options will change on the left window as shown:
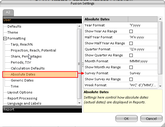
Formatting_Absolute dates |
Settings_Formatting |
Layout Options (Global, User and Report Levels):
These will affect how the report grid is displayed on screen and in exports.
Layout grid tyle - This will change how the row will be displayed if working with multiple breakouts i.e. Network by day etc.
- Tree View - This will display multiple breakouts in one column, each lower level will be indented and in a different colour.
- Grid View (Merged) - This will display multiple breakouts in separate columns. The first (parent) level will be in a singular cell, and every (child) level will be in a separate row.
- Grid View (Un-merged) - This will display the multiple breakouts in individual rows.
Add Blank Row Between Sections - Will add a blank row between different sections
Show Row Headers - Show the element title on the report grid e.g - Market, Network etc.
Export Page Header to the left - at export will export the page header title to the left, if unchecked the page header will be displayed on the right on export.
Display media filter information - Will display Media filter information when media "As selected" is place on the report.
Report Zone item count - Defines the number of items displayed in the report zone. For example if 5 data types is selected; and the report zone item count is set to 2, only the first 2 Data Types selected will be displayed. Note that full information will be displayed in the summary.
Hide Empty Demo Attributes - This will remove NA demo attributes from the display.
Rank Count Position - Change the rank count to display to the left or right of the report.
Include Total for Demo Attributes - This will display Totals for each demo segment when Demographic attributes is broken out in the report layout. Note that totals will only be displayed if specific demo attributes is selected in the Options tab.
Report Processing (User and Report Levels)
Minimum Program Duration - Ignore programs with a duration (in minutes) below this value, when processing reports.
Maximum Program Duration - Ignore Programs with a duration (in minutes) above the specified value when processing the report.
Limit Share to local markets - if selected, all Share values will be limited to the markets covered by the cell. If not selected, Share will be calculated for all selected markets in the report.
Rates Method - Depending on the report requirement select from the three options:
- Average rates across markets - this will average rates across markets when a markets are not broken out or an average result in the Grand Summary
- Total rates across markets or - this will display a sum of all rates across markets when markets are not broken out, as well as an sum of rates in the Grand Summary
- Total rates across stations per market - this will display a sum of rates of stations per market.
Max Length for program names Data Type display - Only applicable in the Ebb and Flow report. This will set the maximum characters for program names in the data type "Program Name"
Program grouping scheme - Select the method to group programs by for Program data types (for program grid reports).
Limit Program data type info to lead market - If selected, this will only display the lead market in the report for Program Data types only.
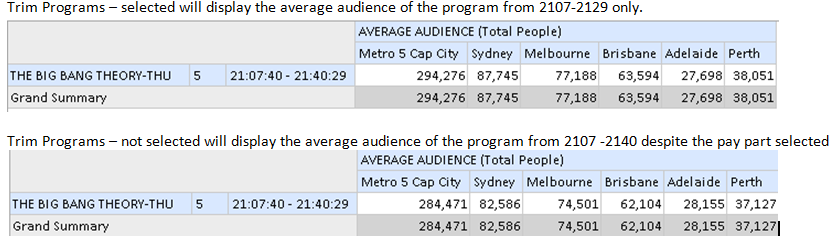
Trim Program times that cross daypart selection - If selected programs will be snapped to day part boundaries. In the example below, a day part of 2100 - 2129 has been selected as well as the Big Bang Theory which aired from 2107 - 2140.
Independent Media Analysis for Ebb&Flow Reports - When selected, the Ebb&Flow Report stations will calculate gains, loss, beneficiary and main contributor for all stations selected. By default this is not selected. For more information see Ebb & Flow report page.
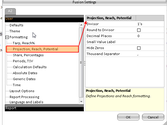
Select Report Potential (Australia Only)
There are three options for a Report Potential, by default, all reports will be set to Auto, meaning the report will use the top most level, this will calculate the TARPs at Metro Five Cap or All RTV potentials if no media levels has been placed in the report.
Auto - If a program aired in just three or four markets, the potential used for TARP calculation will be the Metro Five Cap or All RTV potentiall. If a media level is placed on the report, the potential used will be just for the market (s) that the program aired in.
Report Wide - The Metro Five Cap or All RTV potentials will be used, whether a media level has been applied or not.
Cell by Cell - Potentials used will depend on program activity. eTAM will only use the potentials that the market aired in.
Independent Media Analysis for Ebb & Flow Reports
In the Ebb and Flow report, users can opt to the results independant of each other or have a "master" media in which the ebb and flow results will be analysed from. The master media is the first media selected in the media tab.
Singapore only settings
R&F Apply weighting to seconds viewed - individual weights adjusted by the % of the minute watched
R&F Percentage viewed to be counted (greater than 50) - the % of an spot duration must be watched for viewers to be counted.