One of the newest features of eTAM is basic quick graphing, so that users do not need PowerPoint integration for data visualisation. The graphs are accessed by simply highlighting the data you wish to graph and either right-clicking or then selecting the graph icon on the top right of the screen as shown below. Graphs can then be exported as an image or sent to iPort where users can access them for up to 30 days using any browser enabled device, anywhere in the world.
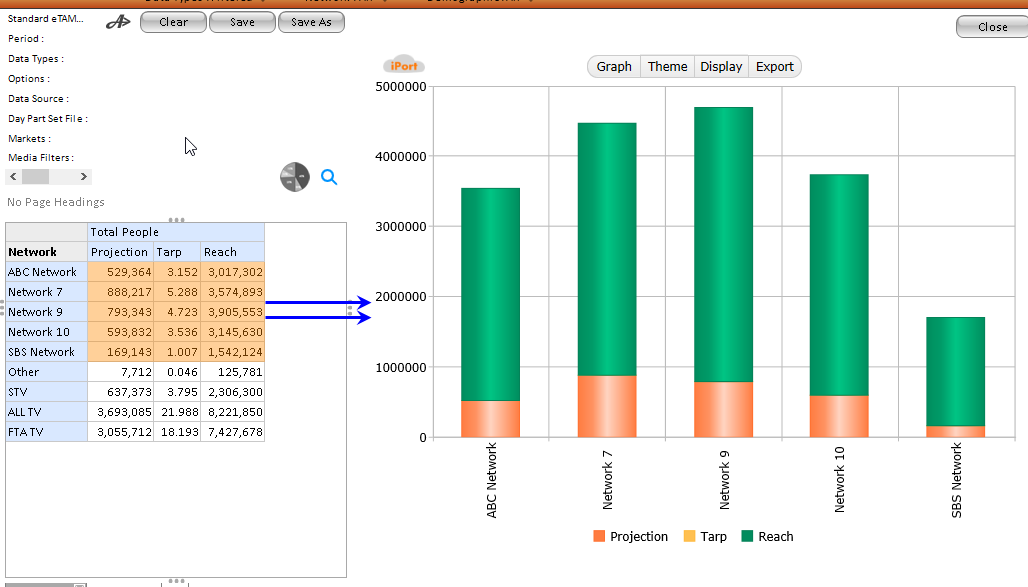
1. First highlight the cells you wish to graph and then right-click the selection or click on the graph icon on the top right of the screen.
2. The fast graph window will open and you can change the graph settings using the graph toolbar. Here you can select a different graph type, change the theme, display options, export to file or iPort, and rename the graph title.
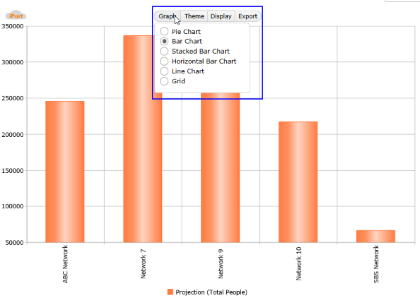
Image Title