The Duplication Venn Diagram can be used to visually compare different stations, networks, dayparts and other values. The diagram displays values and proportions that are unique to an item, common between two items and common to all items being compared. For example, how many people watch 7, 9 and 10 networks exclusively, how many just listen to two of the three networks, and how many listen to all three exclusively.
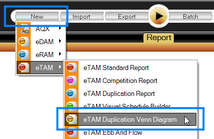
a. To open a new Duplication Venn Diagram, click on New > eTAM > eTAM Duplication Veen Diagram:
b. Users select the options they wish to analyse in the “Setup” area.
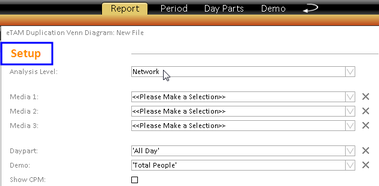
Image Title
c. Clicking the “Play” button will then process the report.

Image Title
d. New features in the eTAM Duplication Venn Diagram.
i. Users can analyse “Groups” of media by simply selecting multiple items in each “Media” dropdown.
ii. Users can rename media to display as they wish by double clicking on the name.
iii. Users can analyse at a “Daypart” level rather than “Media” if they wish by simply changing the “Analysis Level” to “Daypart”. Users can then select 3 dayparts to analyse duplication fo
e. Clicking on the centre of each circle changes which media the % and insights calculate for:
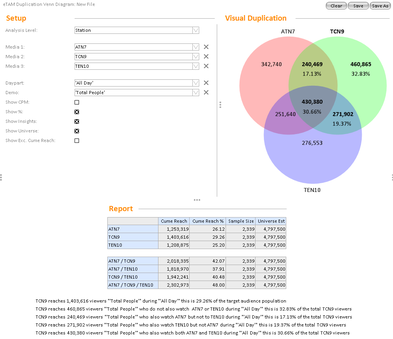
Image Title